R语言与概率统计(三) 多元统计分析
2020-12-13 06:02
标签:alt min cal info highlight 怎么 label mic height 先求对数,再*100 R语言与概率统计(三) 多元统计分析 标签:alt min cal info highlight 怎么 label mic height 原文地址:https://www.cnblogs.com/caiyishuai/p/11163839.html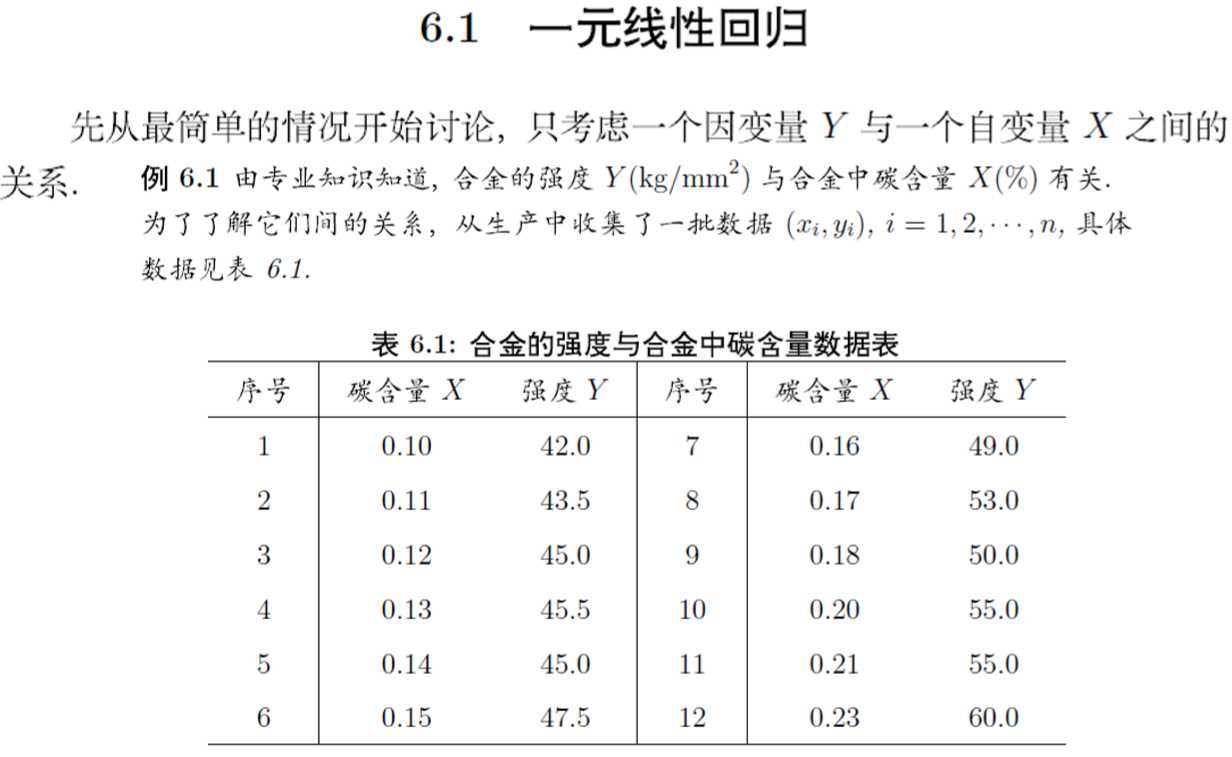
> #############6.2一元线性回归分析
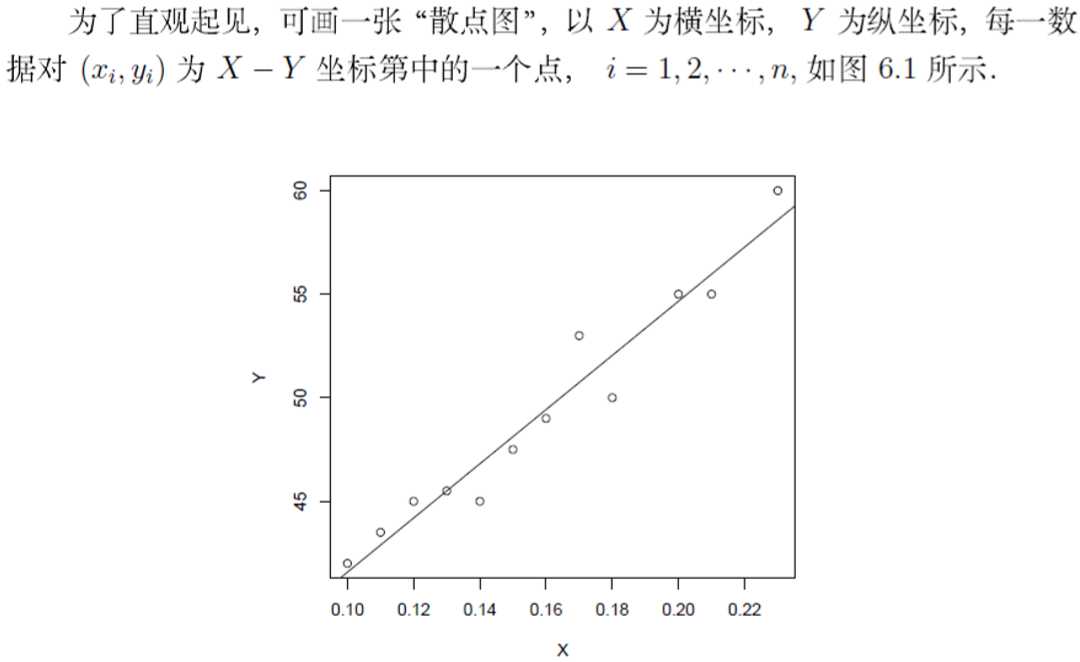
> x y plot(x~y)
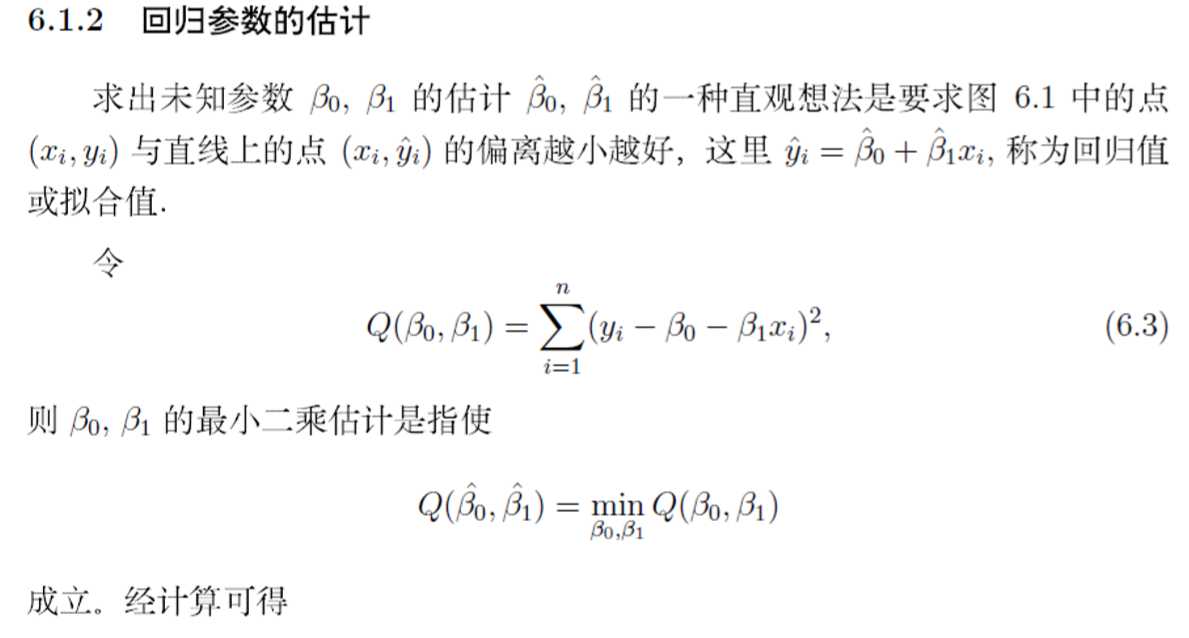
> lm.sol summary(lm.sol)
Call:
lm(formula = y ~ x)
Residuals:
Min 1Q Median 3Q Max
-2.0431 -0.7056 0.1694 0.6633 2.2653
Coefficients:
Estimate Std. Error t value Pr(>|t|)
(Intercept) 28.493 1.580 18.04 5.88e-09 ***
x 130.835 9.683 13.51 9.50e-08 *** #所以y=130.835x+28.493,***表示显著性水平,*越多越好
---
Signif. codes: 0 ‘***’ 0.001 ‘**’ 0.01 ‘*’ 0.05 ‘.’ 0.1 ‘ ’ 1 #显著性水平
Residual standard error: 1.319 on 10 degrees of freedom
Multiple R-squared: 0.9481, Adjusted R-squared: 0.9429
F-statistic: 182.6 on 1 and 10 DF, p-value: 9.505e-08 ¥F检验,检验所有系数全是0的假设
> new=data.frame(x=0.16)#怎么预测多个数值的结果?
> lm.pred=predict(lm.sol,new,interval=‘prediction‘,level=0.95)
> lm.pred
       fit      lwr      upr
1 49.42639 46.36621 52.48657


> X
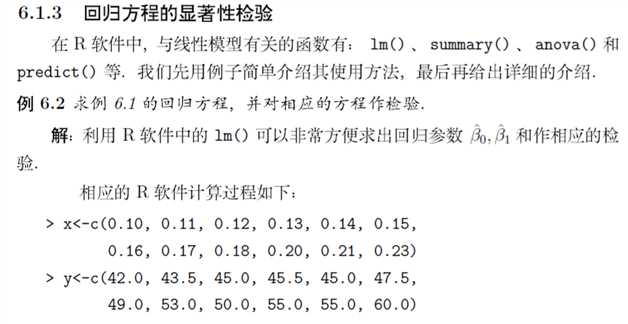
> forbes plot(forbes$F, forbes$log100)#画出两个变量之间的散点图,观察是否存在线性趋势;学习
> #如何从数据框里面调取向量。怎么写坐标轴的名字和标题?
> #如何从数据框里面调取向量。怎么写坐标轴的名字和标题?
> lm.sol summary(lm.sol)
Call:
lm(formula = log100 ~ F, data = forbes)
Residuals:
Min 1Q Median 3Q Max
-0.32261 -0.14530 -0.06750 0.02111 1.35924
Coefficients:
Estimate Std. Error t value Pr(>|t|)
(Intercept) -42.13087 3.33895 -12.62 2.17e-09 ***
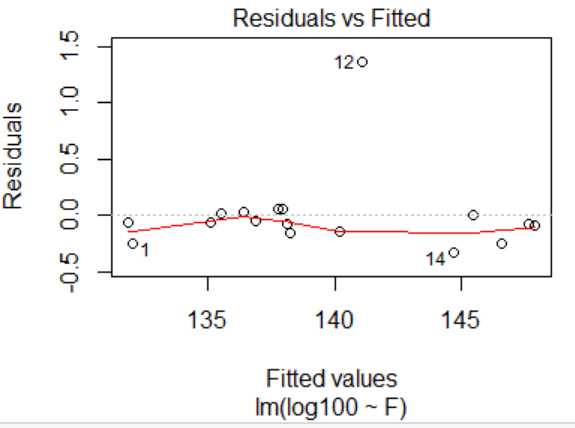
F 0.89546 0.01645 54.45 abline(lm.sol)#在散点图上添加直线
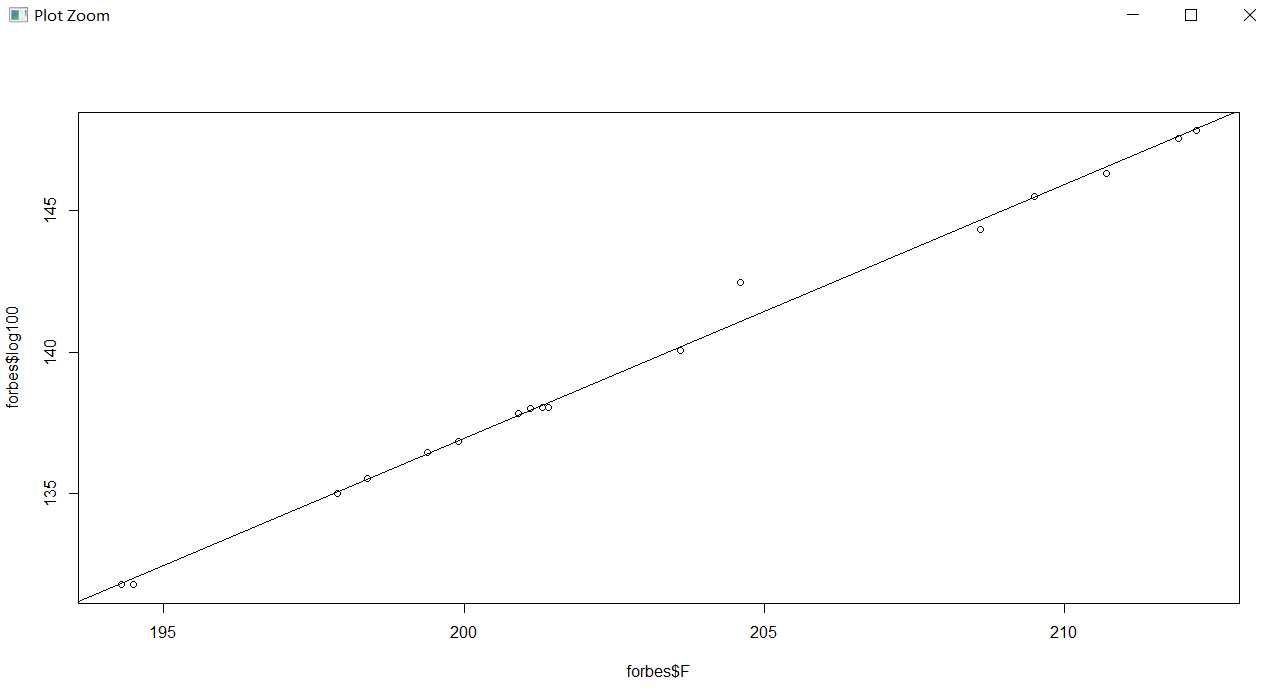
#残差检验
y.res
#异常值的判断
library(car)
outlierTest(lm.sol)
> outlierTest(lm.sol)
   rstudent unadjusted p-value Bonferroni p
12 12.40369         6.1097e-09   1.0386e-07
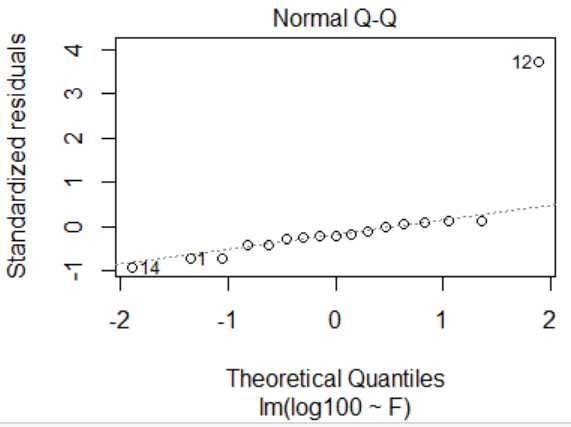
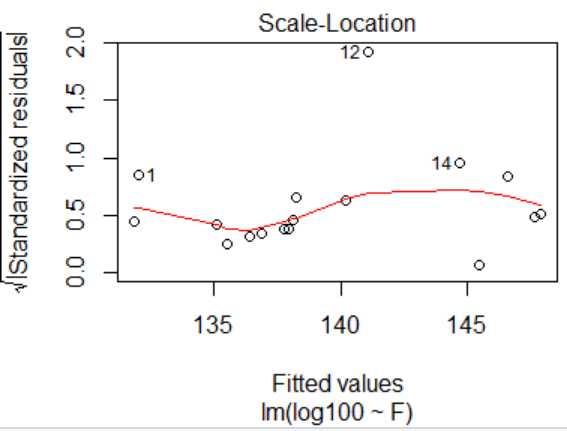
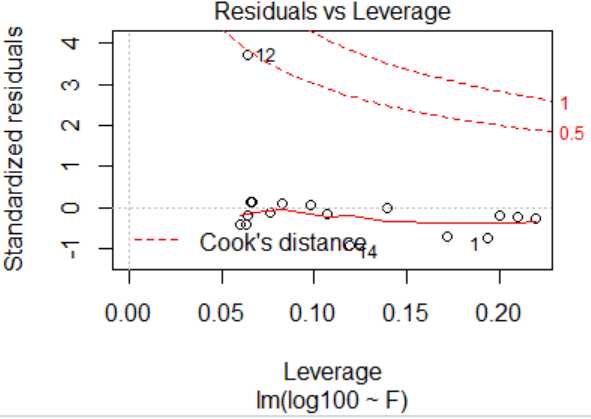
> plot(lm.sol)
Hit