Django API 为 D3 提供数据
2021-06-21 07:05
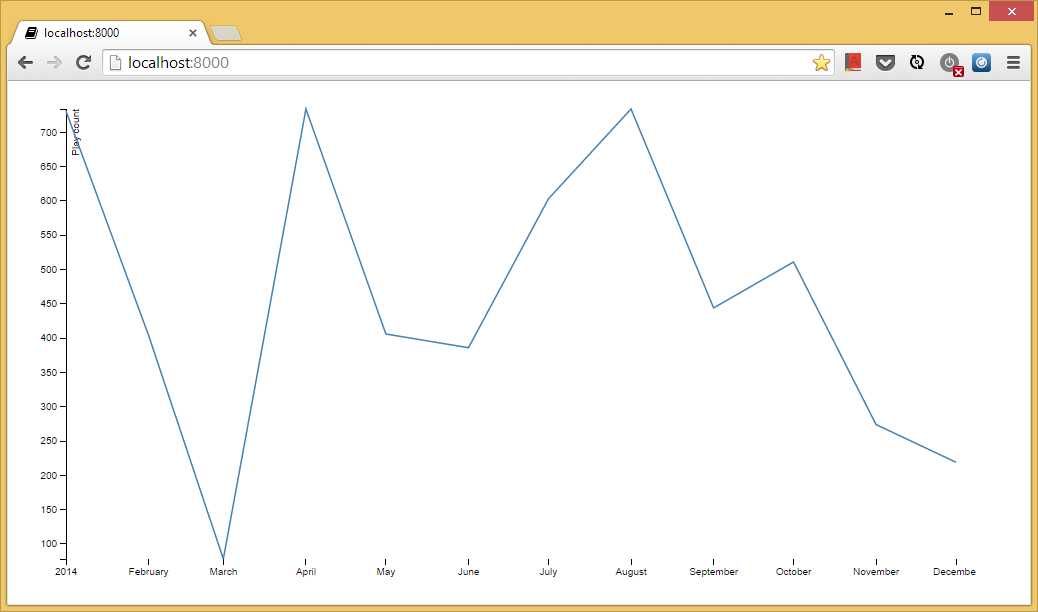
标签:另一个 append display 工作 width trunc view 形式 return 在工作中见过有的人即便使用了Django,依然还在采取json或geojson的文件形式为页面提供数据,相当于嵌入数据而非加载。下面是个简单有效的例子: 先从 model.py 开始 urls.py 建立一个 API 的数据(JSON格式)输出路径,另一个给图像输出页面。 views.py 下面则是HTML部分 输出结果,大家可以在admin里调整数据。 Django API 为 D3 提供数据 标签:另一个 append display 工作 width trunc view 形式 return 原文地址:https://www.cnblogs.com/sctongye/p/10242113.html1 # models.py
2 from django.db import models
3
4
5 class Play(models.Model):
6 name = models.CharField(max_length=100)
7 date = models.DateTimeField()
 1 # urls.py
 2 from django.conf.urls import url
 3
 4
 5 from .views import graph, play_count_by_month
 6
 7 urlpatterns = [
 8     url(r‘^$‘, graph),
 9     url(r‘^api/play_count_by_month‘, play_count_by_month, name=‘play_count_by_month‘),
10 ]
# views.py
from django.db import connections
from django.db.models import Count
from django.http import JsonResponse
from django.shortcuts import render

from .models import Play


def graph(request):
    return render(request, ‘graph/graph.html‘)


def play_count_by_month(request):
    data = Play.objects.all()         .extra(select={‘month‘: connections[Play.objects.db].ops.date_trunc_sql(‘month‘, ‘date‘)})         .values(‘month‘)         .annotate(count_items=Count(‘id‘))
    return JsonResponse(list(data), safe=False)
 1 DOCTYPE html>
 2 meta charset="utf-8">
 3 style>
 4
 5 body {
 6   font: 10px sans-serif;
 7 }
 8
 9 .axis path,
10 .axis line {
11   fill: none;
12   stroke: #000;
13   shape-rendering: crispEdges;
14 }
15
16 .x.axis path {
17   display: none;
18 }
19
20 .line {
21   fill: none;
22   stroke: steelblue;
23   stroke-width: 1.5px;
24 }
25
26 style>
27 body>
28 script src="http://d3js.org/d3.v3.js">script>
29 script>
30
31 var margin = {top: 20, right: 20, bottom: 30, left: 50},
32     width = 960 - margin.left - margin.right,
33     height = 500 - margin.top - margin.bottom;
34
35 var parseDate = d3.time.format("%Y-%m-%d").parse; // for dates like "2014-01-01"
36 //var parseDate = d3.time.format("%Y-%m-%dT00:00:00Z").parse;  // for dates like "2014-01-01T00:00:00Z"
37
38 var x = d3.time.scale()
39     .range([0, width]);
40
41 var y = d3.scale.linear()
42     .range([height, 0]);
43
44 var xAxis = d3.svg.axis()
45     .scale(x)
46     .orient("bottom");
47
48 var yAxis = d3.svg.axis()
49     .scale(y)
50     .orient("left");
51
52 var line = d3.svg.line()
53     .x(function(d) { return x(d.month); })
54     .y(function(d) { return y(d.count_items); });
55
56 var svg = d3.select("body").append("svg")
57     .attr("width", width + margin.left + margin.right)
58     .attr("height", height + margin.top + margin.bottom)
59   .append("g")
60     .attr("transform", "translate(" + margin.left + "," + margin.top + ")");
61
62 d3.json("{% url "play_count_by_month" %}", function(error, data) {
63   data.forEach(function(d) {
64     d.month = parseDate(d.month);
65     d.count_items = +d.count_items;
66   });
67
68   x.domain(d3.extent(data, function(d) { return d.month; }));
69   y.domain(d3.extent(data, function(d) { return d.count_items; }));
70
71   svg.append("g")
72       .attr("class", "x axis")
73       .attr("transform", "translate(0," + height + ")")
74       .call(xAxis);
75
76   svg.append("g")
77       .attr("class", "y axis")
78       .call(yAxis)
79     .append("text")
80       .attr("transform", "rotate(-90)")
81       .attr("y", 6)
82       .attr("dy", ".71em")
83       .style("text-anchor", "end")
84       .text("Play count");
85
86   svg.append("path")
87       .datum(data)
88       .attr("class", "line")
89       .attr("d", line);
90 });
91
92 script>
93 body>
94 html>