标签:return tail 直线 get 资料 对象 count 图片 lis
一 前言
公司近日有个需求,报表的数据以图表的形式展现出来。找了很多相关的资料,最后决定用highcharts图表。
Highcharts是一个制作图表的纯Javascript类库,主要特性如下:
-
兼容性:兼容当今所有的浏览器,包括iPhone、IE和火狐等等;
-
对个人用户完全免费;
-
纯JS,无BS;
-
支持大部分的图表类型:直线图,曲线图、区域图、区域曲线图、柱状图、饼状图、散布图;
-
跨语言:不管是PHP、Asp.net还是Java都可以使用,它只需要三个文件:一个是Highcharts的核心文件highcharts.js,还有a canvas emulator for IE和Jquery类库或者MooTools类库;
-
提示功能:鼠标移动到图表的某一点上有提示信息;
-
放大功能:选中图表部分放大,近距离观察图表;
-
易用性:无需要特殊的开发技能,只需要设置一下选项就可以制作适合自己的图表;
-
时间轴:可以精确到毫秒;
二 废话不多说,直接上干货
1.引入图表所需要的js文件
2.前端cshtml文件
3.后台代码
3.1 list转换成datatable
        ///
        /// list转换成datatable
        ///
        ///
        ///
        public static DataTable ListToDataTable(IList list)
        {
            DataTable result = new DataTable();
            if (list.Count > 0)
            {
                PropertyInfo[] propertys = list[0].GetType().GetProperties();
                foreach (PropertyInfo pi in propertys)
                {
                    //获取类型
                    Type colType = pi.PropertyType;
                    //当类型为Nullable时
                    if ((colType.IsGenericType) && (colType.GetGenericTypeDefinition() == typeof(Nullable)))
                    {
                        colType = colType.GetGenericArguments()[0];
                    }
                    result.Columns.Add(pi.Name, colType);
                }
                for (int i = 0; i
3.2 判断数字是否为纯数字
         ///
        /// 判断数字是否为纯数字
        ///
        ///
        ///
        private bool IsNumber(string str)
        {
            if (str == null || str.Length == 0)
                return false;
            ASCIIEncoding ascii = new ASCIIEncoding();
            byte[] bytestr = ascii.GetBytes(str);

            foreach (byte c in bytestr)
            {
                if (c  57)
                {
                    return false;
                }
            }
            return true;
        }
3.3 读取数据
[HttpPost]
public string HighchartsToJson()
{
List lineChartList = new List();
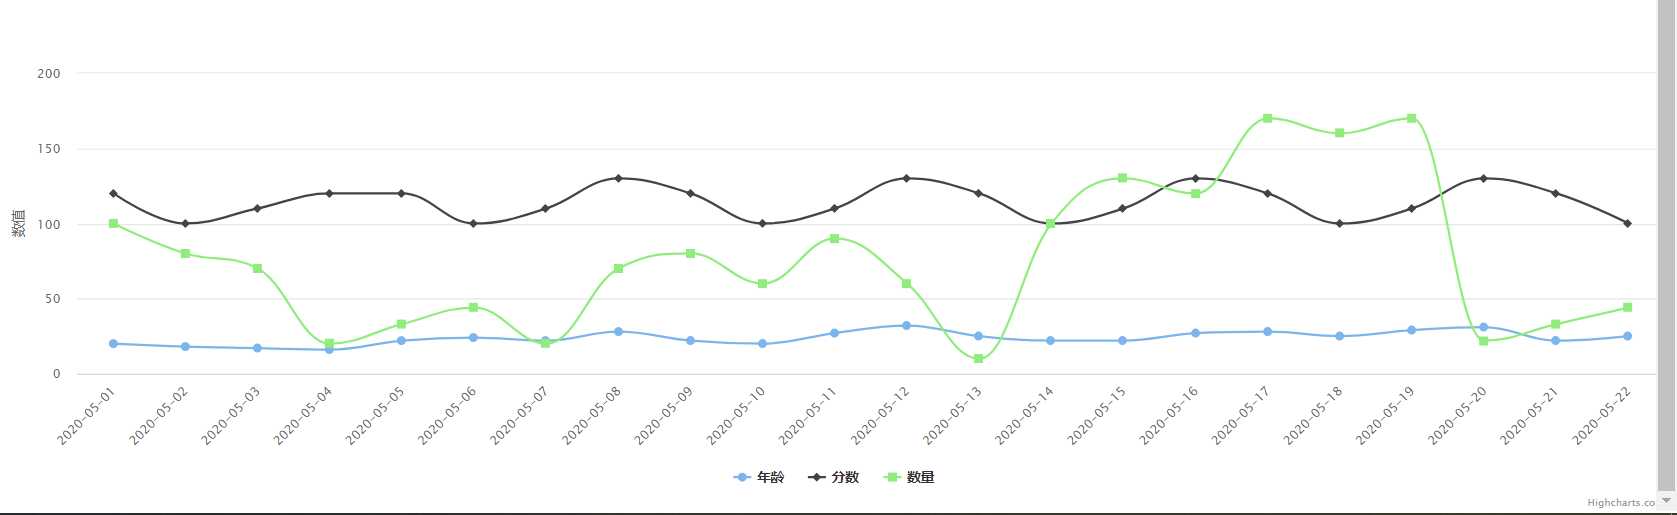
lineChartList.Add(new TableHigh() { Name = "2020-05-01", Age = 20, Score = 120, OrderCount = 100 });
lineChartList.Add(new TableHigh() { Name = "2020-05-02", Age = 18, Score = 100, OrderCount = 80 });
lineChartList.Add(new TableHigh() { Name = "2020-05-03", Age = 17, Score = 110, OrderCount = 70 });
lineChartList.Add(new TableHigh() { Name = "2020-05-04", Age = 16, Score = 120, OrderCount = 20 });
lineChartList.Add(new TableHigh() { Name = "2020-05-05", Age = 22, Score = 120, OrderCount = 33 });
lineChartList.Add(new TableHigh() { Name = "2020-05-06", Age = 24, Score = 100, OrderCount = 44 });
lineChartList.Add(new TableHigh() { Name = "2020-05-07", Age = 22, Score = 110, OrderCount = 20 });
lineChartList.Add(new TableHigh() { Name = "2020-05-08", Age = 28, Score = 130, OrderCount = 70 });
lineChartList.Add(new TableHigh() { Name = "2020-05-09", Age = 22, Score = 120, OrderCount = 80 });
lineChartList.Add(new TableHigh() { Name = "2020-05-10", Age = 20, Score = 100, OrderCount = 60 });
lineChartList.Add(new TableHigh() { Name = "2020-05-11", Age = 27, Score = 110, OrderCount = 90 });
lineChartList.Add(new TableHigh() { Name = "2020-05-12", Age = 32, Score = 130, OrderCount = 60 });
lineChartList.Add(new TableHigh() { Name = "2020-05-13", Age = 25, Score = 120, OrderCount = 10 });
lineChartList.Add(new TableHigh() { Name = "2020-05-14", Age = 22, Score = 100, OrderCount = 100 });
lineChartList.Add(new TableHigh() { Name = "2020-05-15", Age = 22, Score = 110, OrderCount = 130 });
lineChartList.Add(new TableHigh() { Name = "2020-05-16", Age = 27, Score = 130, OrderCount = 120 });
lineChartList.Add(new TableHigh() { Name = "2020-05-17", Age = 28, Score = 120, OrderCount = 170 });
lineChartList.Add(new TableHigh() { Name = "2020-05-18", Age = 25, Score = 100, OrderCount = 160 });
lineChartList.Add(new TableHigh() { Name = "2020-05-19", Age = 29, Score = 110, OrderCount = 170 });
lineChartList.Add(new TableHigh() { Name = "2020-05-20", Age = 31, Score = 130, OrderCount = 22 });
lineChartList.Add(new TableHigh() { Name = "2020-05-21", Age = 22, Score = 120, OrderCount = 33 });
lineChartList.Add(new TableHigh() { Name = "2020-05-22", Age = 25, Score = 100, OrderCount = 44 });
var dt = ListToDataTable(lineChartList);//这里用的是测试数据,可以从数据库读取list对象集合
StringBuilder jsonBuilder = new StringBuilder();
jsonBuilder.Append("{\"");
jsonBuilder.Append("list");
jsonBuilder.Append("\":[");
for (int i = 0; i
三 图形效果
四 总结
在网上找了很多关于Highcharts的资料,有的没有前端完整的代码,有的没有后台的详细代码。都只是侃侃而谈;
没有一个完整的例子,自己记录一下,有这方面的需求,大家可以借鉴一下,不喜勿喷!
highcharts与ajax的应用
标签:return tail 直线 get 资料 对象 count 图片 lis
原文地址:https://www.cnblogs.com/aiyining1314/p/13083987.html